Faith in the Long Run
Contents
About the Author

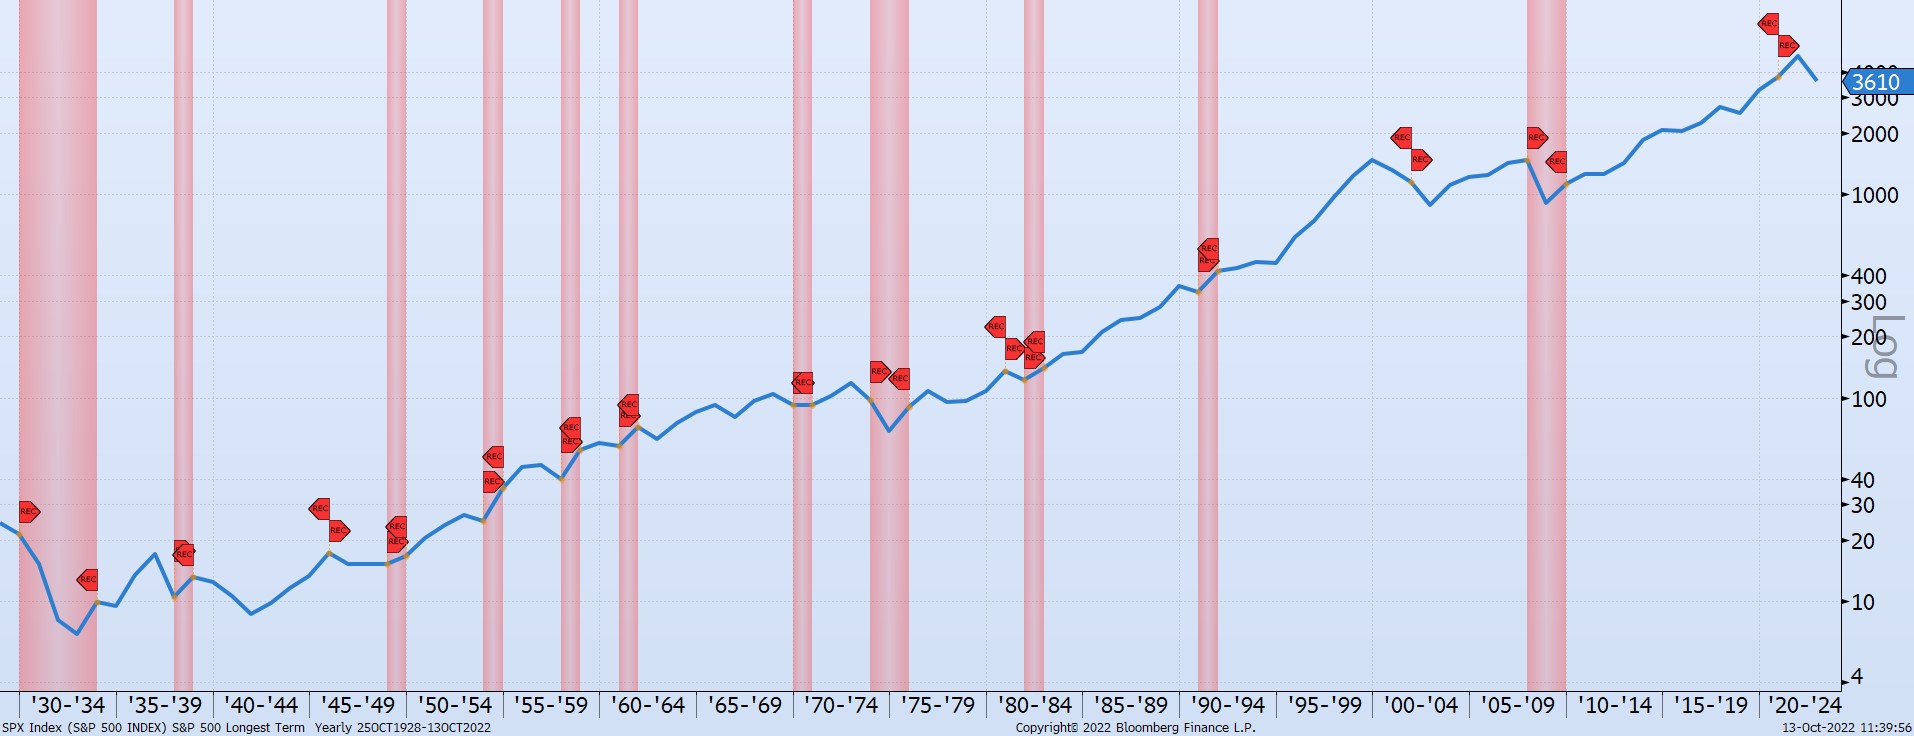
Today’s Chart of the Day shows the S&P 500 index with recessions marked in red going all the way back to 1928.
The S&P 500’s figures are displayed using a logarithmic scale which gives the same appropriate space on the Y-axis (with values notated on the right side of today's chart) for 10 doubling to 20, as 100 doubling to 200, and 1000 doubling to 2000. This is generally accepted as the best way to realistically display a wide range of values.
Since 1930, there have been 15 recessions, which works out to one every 6 ½ years. This chart reminds us that, a) things may not look good now, and b) it may take some time to recover, but we have been here before. In the long run, if you have faith in the resiliency of the United States, things will return.
Samuel serves as Senior Vice President, Chief Investment Officer for the Crews family of banks. He manages the individual investment holdings of his clients, including individuals, families, foundations, and institutions throughout the State of Florida. Samuel has been involved in banking since 1996 and has more than 20 years experience working in wealth management.
Investments are not a deposit or other obligation of, or guaranteed by, the bank, are not FDIC insured, not insured by any federal government agency, and are subject to investment risks, including possible loss of principal.